Investment markets have had a fairly stella run for the financial year to date and the question is, has it been justified.
We are all guilty of looking for the negatives and as always there are some, but economies and consumers are looking surprisingly resilient.
There are trouble spots and some valuations looked stretched, especially in the tech space and the ‘Magnificent seven’*, however earnings growth is reasonable which can mean fundamentals are sound. Nvidia is the star as far as growth in the tech space and their growth is largely based on their microchip advances.
*The Magnificent Seven includes Alphabet (Google), Amazon, Apple, Meta Platforms, Microsoft, Nvidia and Tesla.
If you look at a sample of index performances below you can see in the last 12 months there has been some very rapid growth. This is from 1 March 2023 to 29 Feb 2024.
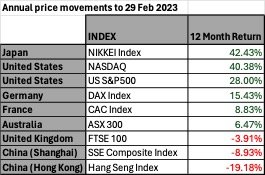
Some of these numbers could indicate a bubble if we look at them in isolation but the NASDAQ, for example, has only just returned to its highs of November 2021.
- The Japanese Nikkei peaked on Dec 29, 1989, and on 26 Feb 2024 finally achieved a new high, 34 years later. There are reasons for its growth including foreign capital taking advantage of a cheap Yen and corporate governance reforms, that were well overdue. Arguably a lot of the good news is now built in, but corporate earnings are solid.
- The broader US index has been lifted by its tech component although if we strip out the Magnificent Sevens’ contribution, it would be closer to 12%. Still good, but more easily justified by earnings growth.
- The UK is definitely suffering post Brexit and if you are travelling on the Australian Dollar prepare for some expense shock. Their costs have seen significant inflation and that has only just started to slow – between September 2022 and March 2023, the Brits had seven months of double-digit inflation. The peak was 11.1% in Oct 2022. January 2024 was 4.0%.

The United Kingdom and China have not faired as well as their peers.
- Brexit looks like it has cost the UK about 5.0% in terms of Gross Domestic Product verses other comparable countries, and they have seen significant economic impacts through reduced trade, weaker business investment and lower ‘legal’ immigration from the EU.
- China has debt problems and there are other internal issues that have reduced investment confidence. It could be that foreign investors are wary of the Chinese Communist Party (CCP), as they have seen the CCP helping itself to corporate profits and installing CCP board members into private Chinese owned companies.
- In the September Quarter of 2023 Foreign Direct Investment (FDI) turned negative for the first time since 1998.
- Youth unemployment is now not even reported. The last number provided was a 21.3% unemployment rate for 16-24 year olds. That was as at 30 June 2023.
- Real estate is described as ‘in crisis’ and home sales have plummeted. The collapse of Evergrande in early 2023 was a lead indicator and it was highly leveraged, but even healthy developers look to be in trouble.
- We have discussed demographics and birth rates before, but the numbers are very real for China. China’s population fell to 1.409 billion at 31 Dec 2023 down from its peak in 2021. In 2022 the population dropped by approximately 850,000 and in 2023 the population looks to have dropped by 2.08million. To have positive population growth you need a birth rate of 2.1 children per woman and China is now considered to be even worse than Japan with a birth rate of 1.09 children per woman. Japan was 1.26 births per woman in 2023.
Read Article: China’s economy had a miserable year. 2024 might be even worse
So, there is definitely a mix of good and bad economic news and China, as our largest trading partner, is definitely a concern for Australian Resource companies and our trade surplus.
As an investor, there is opportunity and risk. The US market is the largest driver of wealth and looks expensive on average if we look at Price to Earnings multiples (P/Es)*. The US average P/E is 20.0 when the historical median is around 16.0. Australia is at 16.4 vs a historical median of 14.5.
*The best way to think about P/Es is the number of years based on current earnings it would take to get your money back. It is just one metric but can indicate when markets are expensive.

The top seven stocks in the US S&P 500 (Top 500 Stocks) Index make up almost 30% of the Index by themselves. Earnings growth* in the US looks healthy at an average of 9.4% over the last eight years (2016-2023).
However, if we strip out those big tech stocks, earnings growth drops to 1.2% on average for the same 8 years.
- Is that a good or bad thing?
*Earnings growth is the profit growth of a company – Inflationary expenses, especially wages growth, will have impacted this but positive earnings growth is usually a good thing.
There are certainly challenges.
- The US is very reliant on these seven companies to show earnings growth and if they don’t, that rate will fall rapidly. Nvidia has a great story and their new ‘Blackwell’ chip is 30 times faster than its predecessor. Its largest four customers are other magnificent seven companies and they make up 40% of its revenue.
- The counter argument:
- That is a risk, but these companies are global companies based in the US and will benefit from any growth in technology use. The West are already big users but there is a lot of potential in populous continents like Africa and South America and countries like India.
- The counter argument:
- There is opportunity within the S&P500 for improved earnings beyond the magnificent seven. The fear has been an aggressive US recession slowing consumer spending and investment but that is looking less and less likely and generally unemployment is solid at 3.9%.
- Interest rate rises have seen ‘zombie’ companies finally go to the wall (Zombie companies are companies that can barely meet there interest payments but were surviving during the Covid era on government support). There were 591 corporate bankruptcies in the US in 2023 and the removal of these companies from the index will reduce the drag on earnings growth.
Based on the above and a whole raft of analysis from our various providers we are seeing the recent market rises as more rational than irrational. This doesn’t mean we shouldn’t take profits and your adviser can discuss that with you.
Remember for clients within the models, this happened on 31 Jan 2024 in our quarterly reweights and will happen again on the 30th of April.
As always if you have any queries or concerns, please do not hesitate to contact us.
The ‘body’ turns 60.
Elle McPherson turns sixty on the 29th March and Australia’s most successful super model is said to be worth $95million. I raise this for two reasons:
- Elle and other models such as Cindy Crawford, Gisele Bündchen, Iman Abdulmajid, Heidi Klum, Naomi Campbell and Claudia Schiffer were the original ‘magnificent seven’ in the 90s. I think this M7 had a little more sex appeal than the current crop?
- Elle was born 5 days before me which means that number is way too close for comfort personally. I have tracked her progress over the years – purely from a financial viewpoint – and frankly would have preferred she let herself go a little.
To all the Arien’s out there, a very happy birthday, and as I keep reminding myself ‘Growing old is a privilege’.
Enjoy a fairly soggy Easter 😊
Regards,
Paul Forbes, RFS Advice CEO