One of the key questions around any presidential election is what impact the chosen candidate, and the election campaign itself, will have on the market.
To answer those questions, we’re able to draw on about a century of US data, given that the S&P 500 index, which tracks the performance of 500 of the largest public companies in America, was founded in 1926.
T. Rowe Price, a global investment management firm, has analysed the data between 31 December 1927 and 31 December 2023, and uncovered some fascinating insights.
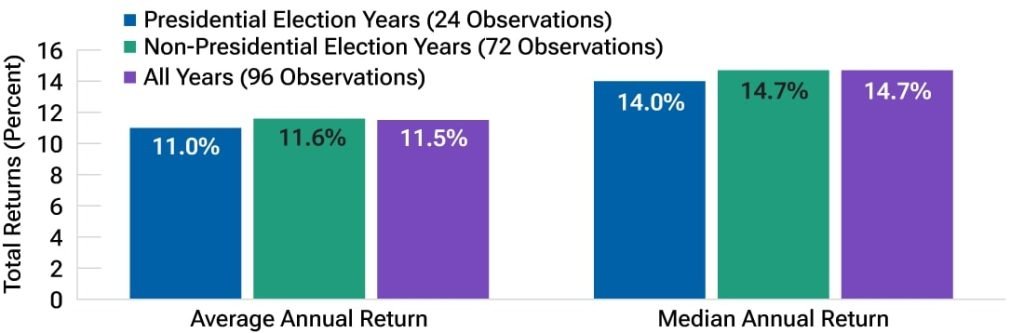
One insight is that the S&P 500 has posted lower returns in presidential election years, compared to both non-presidential years and all years.
Interestingly, though, the market has historically performed differently before and after an election.
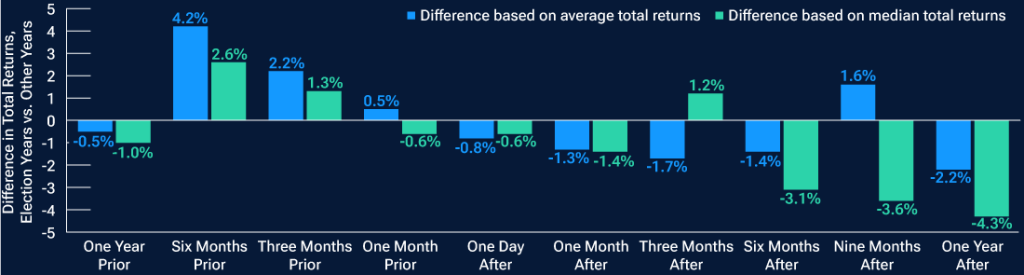
Before an election, the S&P 500 has, on average, delivered higher returns than in non-election years. However, after an election, it has delivered lower returns, over the one-month, six-month and 12-month periods.
(The chart below compares S&P 500 returns before elections versus other years, showing the difference in both average and median total returns.)
Why?
“Perhaps the market took their campaign promises for granted and was disappointed by what ultimately came to pass in the 12 months following the election,” T. Rowe Price speculated.
Another possible reason is that many presidents have had unlucky first years in office.
T. Rowe Price found that 54% of the 12‑month periods following presidential elections have included a recession, compared to 29% for the second year in office, 17% for the third and 25% the fourth.
“In other words, the stock market may have anticipated or responded to weaker economic conditions near the end of a presidential election year, given the higher likelihood of a recession in the following 12 months.”
Given the above data, another of T. Rowe Price’s findings come as a surprise – which is that the S&P 500 has experienced below-average levels of volatility in and around election years compared with similar periods in non-election years.
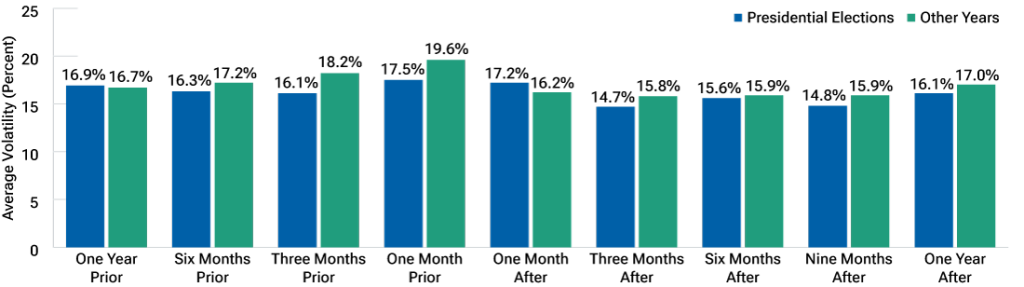
Elections and volatility
Unsurprisingly, there’s a close link between the state of the economy and the election outcome.
Of the 24 presidential elections since 1927, 13 have been won by the incumbent party; but of the six elections that have occurred during a recession year, only one has been won by the incumbent. In other words, while incumbents have won slightly more than half of all elections, they’ve lost the vast majority that have occurred during downturns.
T. Rowe Price’s analysis found that the stock market has tended to be weaker in the run-up to elections that the incumbent party has lost, “potentially reflecting the higher incidence of recessions” during those years.
“When the incumbent party failed to remain in the White House, the S&P 500, on average, experienced higher levels of volatility before the election and in subsequent months, perhaps reflecting the uncertainty created by likely policy changes. In these instances, the month prior to the vote exhibited the highest volatility.”
T. Rowe Price also found:
- When the incumbent party has won, volatility has tended to decline before the election and increase slightly afterwards
- When the incumbent party has lost, volatility has tended to spike before the election and fall afterwards
The local impact
Now that we’ve analysed America, you might be wondering what impact presidential elections have had on the All Ordinaries, which consists of 500 of the largest listed companies in Australia.
Let’s look at the period from 1980, when the All Ordinaries was launched, to 2020, when the last presidential election was held.
During those 41 years, the market delivered an average annual return of 13.0%, including dividends, according to research by Market Index. But during the 11 election years, the average return was only 9.6%.
So, historically, as in America, the local market has underperformed during an election year.
Retain perspective
While this kind of historical research is interesting, it’s important to keep three points in mind.
First, past performance is no guarantee of future performance. Regardless of whether Kamala Harris or Donald Trump win this year’s election, no one knows how the market will react in the days, weeks and months afterwards.
Second, the sample sizes used for this research were small – the history of the S&P 500 includes just 24 election years, while that of the All Ordinaries includes just 11 – which means we can’t use it to draw meaningful conclusions.
Third, even if we could draw meaningful conclusions, it might be best to ignore them. That’s because, for most people, the best investment strategy requires being invested for the long-term, irrespective of how markets may perform in the short-term. Hence Warren Buffet’s famous quote: “The stock market is designed to transfer money from the active to the patient.”